In logistics, very little of every euro of revenue is left. That is exactly why a euro you do not give away counts so heavily. This article works out what the residual value of your material handling equipment is really worth, measured against the published margins of six logistics companies.
Revenue equivalent is the amount of extra revenue a company would have to generate to achieve the same result through normal operations as it would from a saving or an extra return. At an operating margin of 5 per cent, € 10,000 of result equals € 200,000 of revenue equivalent.
More volume with the same people, less damage, less downtime, a smarter warehouse layout. Logistics organisations work on this every day, and rightly so. But there is one item that stays structurally out of view: the value of the equipment itself.
Forklifts, reach trucks, pallet trucks and order pickers are needed to keep the operation running, but together they also represent a substantial sum. That value begins at purchase and only ends when the machine leaves the site.
So the question is not only what a new machine costs. The question is also how much value comes back out at the end, and how much of that you actually collect. What that is in your case can be worked out free of charge with the Residual Value Check. But first, the sum that shows why it is worth the trouble.
How thin are those margins really?
To understand why this matters, you need to know the margins logistics companies actually work with. Below are the published annual figures of six companies: large international players, a French contract logistics specialist, and two names everyone in the Netherlands knows.
Operating margin, most recent published financial year
0 %7 %
EBIT divided by revenue, except for ID Logistics (underlying operating income), GXO (operating income under US GAAP) and Mainfreight (profit before tax). Figures and sources are listed at the end of this article.
A few notes, because without context these numbers say too little.
Kuehne+Nagel reports, alongside that EBIT of CHF 217 million, a recurring EBIT of CHF 255 million, a record for this division. That works out at 5.3 per cent. The difference is restructuring costs. Both figures are correct; it depends which one you take.
GXO sits at the bottom with 1.9 per cent, but that is also the least representative figure. In 2025 GXO integrated the acquired Wincanton, and that result includes roughly $180 million of one-off items: transaction and integration costs, restructuring, legal costs and a loss on a divested business. Without those items the margin comes out around 3 per cent.
Vos Logistics sits at the low end with 2.6 per cent, but that is a substantial recovery: in 2024 EBIT was still € 3.8 million and net earnings were nil. It shows how sharply things swing in this part of the market.
What you should not take from this is a single fixed percentage for the sector. That does not exist. The type of service, the contract structure, the capital intensity and the country you work in all make an enormous difference.
What you can take from it: margins sit somewhere between two and seven per cent, and contract logistics players are generally around four to five. At margins like that, it takes a lot of revenue to make a modest amount of extra result.
What that means in revenue
Turn that margin around and you get the revenue equivalent: the amount you would have to turn over to keep € 10,000 of result through the operation.
Needed for € 10,000 of extra result
The thinner the margin, the more revenue is needed for the same result. And the more heavily a euro weighs that you do not have to give away.
In the rest of this article we work with 5 per cent. That is deliberate, because it sits above the average of the six companies above. If you were to use a lower margin, the effect we show would only be larger. So we choose the figure that works least in our favour.
So what is € 10,000 of extra residual value worth?
Suppose an organisation gets € 10,000 more out of its existing equipment during a replacement round than it would have if those same machines had been traded in the usual way.
At a 5 per cent margin that equals € 200,000 of revenue. Not because residual value is the same as revenue, but because you would have to turn over € 200,000 to reach the same result through the operation.
And that is where the difference that really matters lies: that € 200,000 of revenue brings costs with it too. Extra orders, extra hours, extra space, extra transport movements, extra risk. That € 10,000 of residual value brings none of it. The machines have already been bought, have already done their work and are already standing on your site. It is only a question of how much of the remaining value you actually collect.
A euro you do not give away is a euro you never have to earn back.
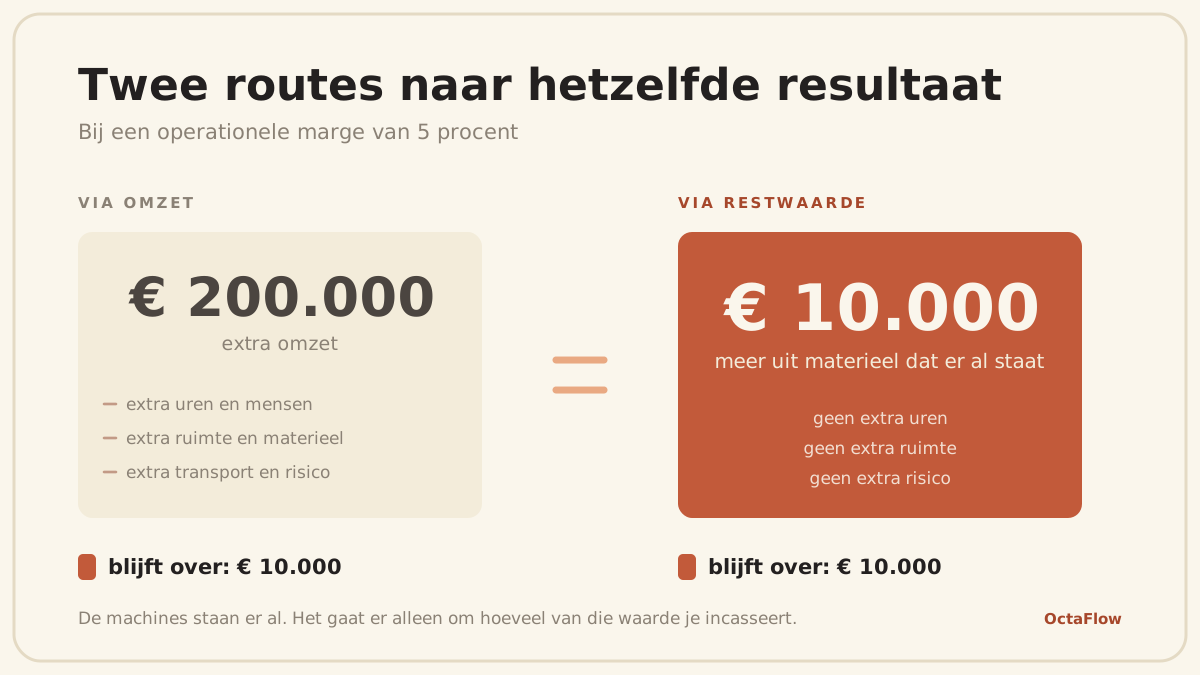
Both deliver € 10,000. But the route on the left first requires € 200,000 of revenue, and the route on the right only requires knowing what your equipment is worth.
Do you know what your equipment is really worth? Register your machines and we will collect a second price from the market. Within five working days you know where you stand.
It is not about a fixed amount per machine
Do not pretend every machine can simply bring in € 1,000 or € 2,000 more. A fleet is made up of very different equipment, and value develops very differently across it. A pallet truck worth a few thousand euros is a different story from a forklift worth tens of thousands. Age, running hours, configuration, battery condition, technical state, maintenance history and current demand in the market all play a part.
On a pallet truck, a few hundred euros can already be a sizeable difference. On a heavy forklift with an attachment it can run into thousands.
That is why it is more useful to look not at an amount per machine, but at the improvement compared with the trade-in offer you already had. That is a figure you know, and the difference is directly measurable. Work it out for your own situation below.
Calculator
At a margin of 5.0 %, 10 % more on a trade-in offer of € 50,000 delivers the same result as € 100,000 of extra revenue.
The percentages are worked examples, not market averages and not a promise. What is actually there depends on the machines, the market and the route you choose.
Prefer a table to a slider
| Trade-in offer | +3 % | +5 % | +10 % | +15 % | +20 % |
|---|---|---|---|---|---|
| € 10,000 | € 300 | € 500 | € 1,000 | € 1,500 | € 2,000 |
| € 25,000 | € 750 | € 1,250 | € 2,500 | € 3,750 | € 5,000 |
| € 50,000 | € 1,500 | € 2,500 | € 5,000 | € 7,500 | € 10,000 |
| € 75,000 | € 2,250 | € 3,750 | € 7,500 | € 11,250 | € 15,000 |
| € 100,000 | € 3,000 | € 5,000 | € 10,000 | € 15,000 | € 20,000 |
| € 150,000 | € 4,500 | € 7,500 | € 15,000 | € 22,500 | € 30,000 |
What the table and the calculator both show: you do not need an enormous fleet for this. If you receive € 50,000 in trade-in value and get 10 per cent more out of it, that is € 5,000. At a 5 per cent margin that is the result of € 100,000 of revenue.
And if you lease?
This is the question that is almost always skipped in stories like this, while for many logistics companies it is the most important one. A large share of material handling equipment is not on the balance sheet at all, but on a lease or full-service rental contract.
In that case the residual value goes to the leasing company, not to you. At the end of the term you hand it back and that is that.
But that does not mean it is none of your business. You pay for that residual value every month. When setting the rate, a leasing company assumes an expected residual value at the end of the term. You pay the difference between the purchase value and that expected residual value, spread over the term, plus interest and margin. If that assumed residual value has been set too low, you pay for it every month for five years.
So the question "what will this equipment actually be worth" is just as relevant for a lessee. You simply ask it at a different moment: when signing the contract, not when disposing of the equipment. And at the end of the term there is a second question that is rarely asked: is handing it back really the best option, or is buying it out and selling it yourself worth more?
Whether you own the equipment or not, it pays to know what is actually in it.
Total Cost of Ownership: purchase and residual value belong together
Residual value is the last chapter of the financial life cycle. The first is the purchase, and the same opportunity sits there, only in reverse: not getting more back at the end, but spending less at the start.
Buying a machine € 1,000 cheaper sounds good, but the purchase price on its own tells you nothing. If that machine needs more maintenance, uses more energy, stands still more often or is worth less later, the saving has evaporated before you notice it.
That is why buying sharply should always start from Total Cost of Ownership. Not: which supplier is cheapest on paper today. But: which solution works out best across the whole service life. That is precisely where comparing MHE quotes often goes wrong.
The financial life cycle of a machine
Purchase
Not the lowest price on paper, but the lowest cost across the whole service life.
Use
Maintenance, energy, tyres, battery, downtime and damage. This is where most of the cost sits.
Disposal
How much of the remaining value actually comes back, and by which route.
These three are not separate. What you choose at 1 determines what happens at 2 and what is left at 3.
A good TCO calculation includes maintenance, energy, battery, tyres, repairs, operating hours, downtime, damage, service life and residual value.
That automatically ties purchase and residual value together. A machine that costs a little more can be the better financial choice if it runs cheaper and is worth more later. And conversely, a seemingly cheap machine can turn out expensive.
Seen that way, buying sharply and achieving a higher residual value are not two subjects but two moments in the same cycle. Always with the same goal: keeping more.
Suppose an organisation invests € 1 million in a new fleet. If a better TCO analysis and tender save 2 per cent, that is € 20,000. If you then get another € 20,000 out of disposing of the old fleet, you are at € 40,000. At a 5 per cent margin you would have to turn over € 800,000 for that.
The effect is in the sum of the parts
It is not about one machine that happens to fetch a few hundred euros more. It is about what happens when that becomes structural.
A pallet truck that brings in € 300 more than expected. A forklift that does € 1,500 better. A tender that saves € 800 per machine. A maintenance contract set up more intelligently. On their own these are not spectacular amounts. Across dozens of machines and several replacement rounds they become exactly that.
That is why it makes sense to look not at one forklift, not at one quote and not at one trade-in value, but at the whole flow of equipment moving through your organisation.
What does this mean for your organisation?
A few questions that usually make the answer clear quickly:
- How much material handling equipment do you replace per year, and what is that worth together?
- How is the residual value determined now, and by whom?
- Does anyone look independently at the real market value, or do you accept your supplier's offer?
- Are purchasing decisions made on purchase price or on Total Cost of Ownership?
- Do you know what residual value has been assumed in your lease contracts?
If the answer to a few of these questions is unknown, there is probably financial room there. Not in large amounts per machine, but in small differences that add up.
More result does not have to come from more revenue
In logistics a lot of attention goes to growth. Understandable, but growth is not the only route.
Sometimes the improvement is in a better purchase. Sometimes in a lower Total Cost of Ownership. Sometimes in more efficient deployment. And sometimes simply in preventing value from leaking away at disposal.
The thinking behind it is simple. Every euro you do not spend is a euro you do not have to earn back through revenue. And every euro you get extra out of existing equipment is a euro you do not have to earn again either.
So the question is not only how much revenue you can add. The question is also: how much result can you add to the revenue you already make?
That starts with looking more carefully at what is already standing there.
Five minutes per machine, and you know. Fill in what you have standing. We collect the prices from the market, you put them next to your own offer and take the highest.
Frequently asked questions
Is € 10,000 of residual value really the same as € 200,000 of revenue?
No. It means that at an operating margin of 5 per cent you have to turn over about € 200,000 to keep € 10,000 of result. The € 10,000 of residual value delivers that same result without the extra costs, hours and risks that come with that revenue.
Which margin should I use myself?
Your own organisation's. The six companies in this article sit between 1.9 and 6.5 per cent. If your margin is lower than 5 per cent, the revenue equivalent is higher than the amounts shown here.
Does this apply if I lease my forklifts?
Yes, but at a different moment. The residual value is then built into your monthly rate. If it has been set too low, you pay for that across the whole term. And at the end, buying it out and selling it yourself is sometimes worth more than handing it back.
How much more does a different sales route deliver?
That differs per machine, per market and per moment. The percentages in this article are worked examples. The only way to know it for your equipment is to put a second price next to your trade-in offer. That can be done free of charge with the Residual Value Check.
Sources and method
All figures come from the annual results published by the companies themselves for their most recently closed financial year. Retrieved on 21 September 2026.
- DHL Supply Chain, financial year 2025: revenue € 17,778 million, EBIT € 1,161 million, EBIT margin 6.5 per cent. Source: DHL Group annual report 2025, Supply Chain division chapter.
- Kuehne+Nagel Contract Logistics, financial year 2025: net turnover CHF 4,805 million, EBIT CHF 217 million (4.5 per cent). The press release accompanying the annual figures also states a recurring EBIT of CHF 255 million (5.3 per cent). For this division Kuehne+Nagel reports 11.7 million square metres of warehousing and logistics space and 38,706 operational staff.
- ID Logistics, financial year 2025: revenue € 3,737.0 million (+14.2 per cent), underlying operating income € 165.2 million (4.4 per cent). Source: annual results press release, 11 March 2026.
- Mainfreight Europe, financial year to 31 March 2026: revenue € 624.0 million, profit before tax € 25.2 million (4.0 per cent). This is a result before tax and therefore not fully comparable with an EBIT.
- Vos Logistics, financial year 2025: revenue € 356 million, EBIT € 9.3 million (2.6 per cent), net profit € 4.5 million. For comparison: in 2024 EBIT was € 3.8 million with a break-even net result. Source: Vos Logistics press release, 2 April 2026.
- GXO Logistics, financial year 2025: revenue $ 13,178 million, operating income $ 245 million (1.9 per cent). That result includes roughly $ 180 million of one-off items related to the integration of Wincanton.
On comparability. The profit measures used are not identical. DHL, Kuehne+Nagel and Vos Logistics report EBIT, ID Logistics an underlying operating income, GXO an operating income under US GAAP and Mainfreight a result before tax. They are therefore indicative rather than an exact like-for-like comparison. The point is the order of magnitude, and for all of these companies it sits below seven per cent.
On the margin used in the calculations. The worked examples assume 5 per cent. That sits above the average of the six companies named. At a lower margin the revenue equivalent comes out higher. So the percentage chosen is deliberately the one that supports the argument of this article least.
On the percentages for extra residual value. These are worked examples, not market averages. The real room differs per machine, age, configuration, running hours, technical condition, market and sales channel.

Sjef Kerkvliet is the founder of OctaFlow and has more than 15 years of experience in intralogistics, warehouse optimisation and internal transport. Drawing on his hands-on experience, he helps organisations with questions around goods flows, process improvement, warehouse layout, automation and operational efficiency.
Want to talk about your operation?
A logistics or operational challenge? OctaFlow is happy to think along. No fuss, just a good conversation.